Mainnavigation
Subnavigation
BORDER
Pagecontent
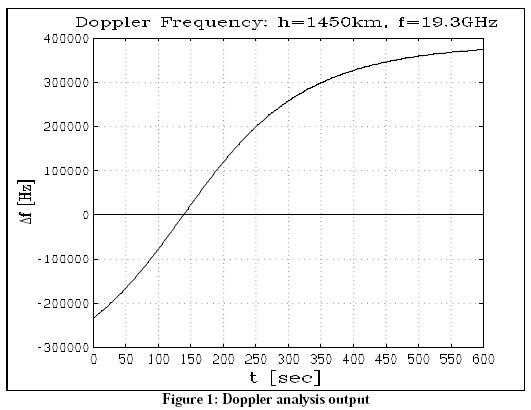
Calculation of a SatCom Doppler Frequency
The plot below shows the analysis of the Doppler frequency for a satellite passing overhead.
% Demo: Doppler frequency of satellite
%
% This demo sets up a satellite passing overhead and
% computes and displays the doppler frequency
%

removeAll;
setSimEpoch(2002,3,26,12,0,0);

% Start time for simulation
setSimStepSize(1);
addEpoch('Teledesic',2002,3,26,12,0,0);

% Epoch group of satellite
addSatellite('S1a',7728,0,90,9,0,0,'Teledesic');

% Define satellite
setSimTime(0)

% Initialize simulation
g = GeoPosition(3);

% Get geographic position of satellite
g(1:2) = g(1:2)*r2d;

% Convert from radians to degrees
addStation('E1',I_earth,45,g(1)+7.5,g(2),0);

% Add station 7.5 deg north of satellite
t = 0:1:600;

% Define simulation time vector
rvec=zeros(size(t));

% Initialize vector of relative velocities
j = 0;
for i = t,
    j = j+1;
    stepSim;

    % Advance simulation by 1 sec
    [d,r,a,e,v] = RelPosition('E1');   % Get distance, rel velocity, ...
    rvec(j) = r(2);                    % Store rel velocity in array
endfor

erase

window('111');
plot(t,rvec*19.3e9/cLight, 'grid');

% plot rel velocity, converted to doppler f
title('Doppler Frequency: h=1450km, f=19.3GHz')
ylabel('df (Hz)',
       'Fl s ls');
xlabel('t [sec]')