Mainnavigation
Subnavigation
BORDER
Pagecontent
- You are here:
- Home »
- MLDesigner »
- Examples »
- Process Applications »
- Production Control System
Production Control
Introduction
This library of models provides modular building blocks for designing and optimizing Production Authorization Card (PAC) controlled complex manufacturing systems.
Concept
The PAC system, developed by Buzacott and Shanthikumar, is a token-based decentralized technique for coordinating and controlling the flow of material and information in multi-cell manufacturing systems?essentially a token-controlled multi queue multiserver system.
An example PAC system is shown in Figure 1.
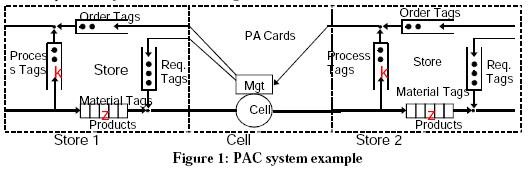
This example shows a three-element PAC model consisting of a customer (store 2) a processing system (the cell) and a supplier (store 1.) The thin lines represent the flow of tokens, the thick lines represent the flow of products. Different types of tokens flow through the Cell and the Stores.
- PACs (Production Authorization Cards) authorize cells to process parts. In Figure 1, Store 2 sends Process Authorization Cards to the Cell.
- Requisition tags are sent by the Cell to Store 1 to request an item. If the item is not available, the request tags wait in a queue.
- Order tags are sent by the Cell to Store 1 to inform store1 that there will be demand for a product in the future. Order tags permit advanced scheduling. There is a requisitiontag for every order tag.
- Process tags are sent by Store 1 to the Cell and by the Cell to store 2 when an item ships.
The MLDesigner Library
The MLDesigner PAC library consists of modules that represent key APC system components and several PACs system models constructed from these components that represent different designs. Tags or Tokens are represented by data structures.
The base data structure has fields that can be used to represent any of the cards or tags.
- Order number
- Product number
- Quantity
- Cell number
- DLZ orders
- DLZ materials
- Material serial number
- Supplier
- Card Type
- Available Parts
We show the key modules (Cell, Store) first. The block diagrams are organized to separate the information and product paths just as shown in Figure 1 with information paths are at the top of the diagram, product patch are in the middle of the diagram. This library contains a large number of custom primitives. All modules are parameterized.
Note: This model was developed in Germany. Labels have been left in the original German.
Figure 2 shows a cell, Figure 3 a store.
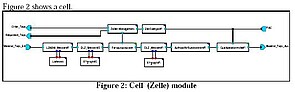
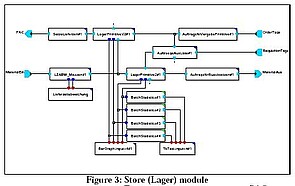
Figure 4 shows a customer module. The customer module generates PACs and sends
them to the manufacturer cell and Figure 5 shows the supplier module.
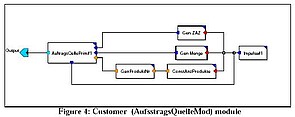
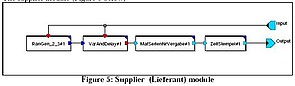
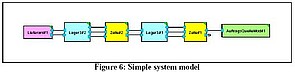
Figure 6 shows a simple PAC model consisting of a customer, a single supplier, two stores and two cells. The blocks are color coded. A much more complex model is shown in Figure 7. The blocks are coded as in Figure 6. Although the model is far more complex, only one additional block type is used.
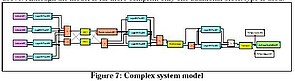
The model above has four suppliers, each with an associated store, initial processing cells (VM1, VM2), three intermediate stores, a final assembly cell with two associated stores and a transport system (which is also modeled with a Cell module.) In addition, there are several distributors and a router to manage the flow of messages and products.
Order-related tags (PACs, order tags, requisition tags) flow from right to left; process tags and completed products and components flow from left to right. The flow of completed products stops at the Transport block, where the transport delay is added.
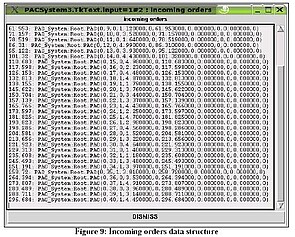
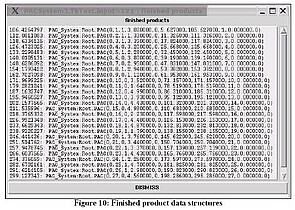
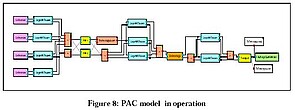
The two white blocks located above and below the customer (AuftragsQuelleMod) block are dynamic feedback blocks that show the flow of incoming orders (top bock) and completed products (lower block.) These blocks are particularly useful when running the simulation in graphic animation mode as shown in Figures 8-10.
Running the simulation in graphic animation model makes it easy to understand how the model works. In animation mode each block changes color when fires displaying the flow of operations. Figure 8 below shows the model near the end of the simulation; the final assembly Cell (Endmontage) is active and has a unique color. Figures 9 and 10 show PAC data structures that have been transmitted from the customer (incoming orders) and data structures representing completed and shipped products (finished products) respectively.
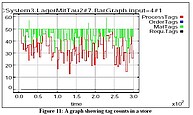
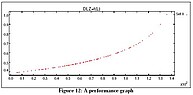
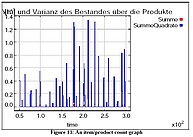
Built-in statistical modules generate automatic reports describing the operation of the model. Three examples are shown below.