Mainnavigation
Subnavigation
BORDER
Pagecontent
- You are here:
- Home »
- MLDesigner »
- Examples »
- Wireless/Mobile Applications »
- IEEE 802.11 b,g
WLAN_Abstract: Mixed 802.11 B & G Stations with Dynamic Instantiation
Library for performance level exploration of multi standard 802.11 operations
The WLAN_ABSTRACT is a custom library of components for exploring 802.11 operations. The library includes a large collection of building blocks that can be used to build custom 802.11 system models together with four demonstration system models and six test modules. The WLAN_ABSTRACT provides a flexible environment for analyzing 802.11 networks. The demonstration systems provide a base for initial analysis and they can easily be modified by swapping components (e.g., traffic generators data outputs, etc.) for other components contained in the library.
This data sheet provides an overview of one demonstration model: mixed 802.11b and 802.11g station using dynamic instantiation. The Mixed g and b station DynInst is a system model built of library components that models the behavior of an 802.11 system where 802.11b and 802.11g stations are served by a single system that supports both protocols.The number of 802.11b and 802.11g stations is set by parameter and the stations are generated dynamically.
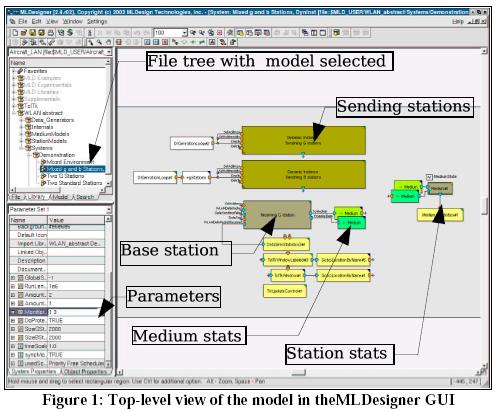
A top-level view of the model is shown below. Control parameters are shown in the lower left window.
Top-level parameters for this system model include:
- Number of G stations
- Number of B stations
- Specify two stations to monitor
- Size of message for G stations
- Size of message for B stations
- RunTime
- Time scale
The functional areas of the block diagram for the system model are shown in more detail below. Blocks with green upper right corner are modules that contain lower-level block diagrams. Blocks with blue upper right corners (e.g., TclTk window#1) are primitives that contain source code. The medium models the 802.11 b/g channel.
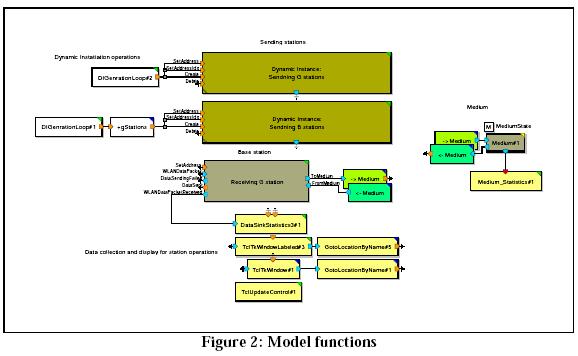
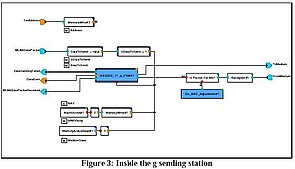
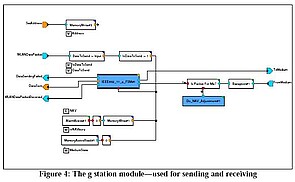
The sending station (Fig.3) is comprised of one of the traffic generators, an 802.11g station module and a primitive that represents the medium. The station module (Fig.4) can be modified to work with other traffic generators.
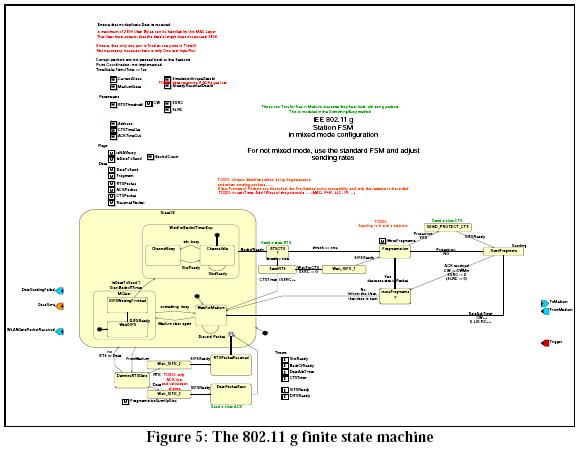
This model incorporates Finite State Machines for the b/g station and for the medium. The station FSM is shown below (Fig.5).
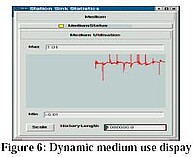
The model generates many dynamic and static output graphs. One of each type is shown below. The first graph (Fig.6) is a dynamic medium utilization graph. A status LED continuously reports medium status via color changes.
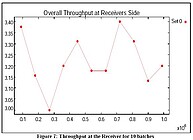
The summary graph below (Fig.7) shows the overall throughput at the receiver side for each of 10 batches (time periods) that represent the total simulation time.
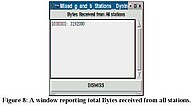
The model also generates several window reports showing total values (Fig.8).