Mainnavigation
Subnavigation
BORDER
Pagecontent
- You are here:
- Home »
- MLDesigner »
- Examples »
- Networking Applications »
- Special Purpose "Simple" Network
A Special Purpose "Simple" Network
Performance level model of AFDX switched Ethernet network
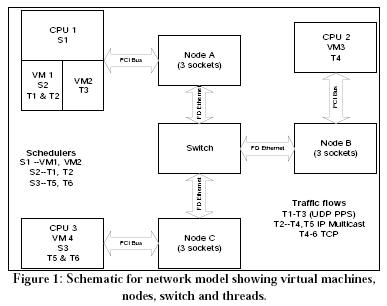
A small, special-purpose network (Figure 1) connects three computers through a layer 3 switch. Computers consist of CPUs connected to nodes via PCI buses. CPU1 is partitioned into two virtual machines. This model demonstrates several abstraction techniques. CPU actions and message transmissions are defined as resource costs that are used with quantity resources that represent memories and buffers, and by the server resources represent CPUs, busses, and cables. Shared memory makes information available to blocks simultaneously. Hierarchical data structures carry messages between blocks (e.g., move routing table entries), represent the flow of data messages through the protocol stack (with support for encapsulation, addressing, etc.) and collect statistical data for performance analysis.
The Design Requirements
The network model consists of:
- A layer-3 switch with full duplex connections
- Three processors: CPU1, CPU2, and CPU3 with associated nodes: A, B, C. Each node has 3 sockets.
- PCI busses between the processors and the nodes
- Four partitions or Virtual Machines:VM1, VM2, VM3, VM4<br />
- VM1 and VM2 are on CPU1
- VM3 is on CPU2
- VM4 is on CPU3
- Six threads: T1, T2, T3, T4, T5, T6
- T1 and T2 are associated with VM1
- T3 is associated with VM2
- T4 is associated with VM3
- T5 and T6 are associated with VM4
- Three schedulers: S1, S2, S3
- S1 schedules processing time between VM1 and VM2 in processor P1, specified tick (parameterized)
- S2 schedules processing time between T1 and T2 within VM1, specified as a priority preemptive schedule (PPS)
- S3 schedules processing time between T5 and T6 within VM4, specified as a PPS
- Three traffic flows:
- UDP (datagram) (BDI): T1 -> T3 (Loop back through Node A with two sockets (does not go through the switch)
- UDP (datagram) (PDI) multicast: T2 -> T4, T5 (one socket at Node A, one socket at Node B, and one socket at Node C)
- TCP (with Ack): T4 -> T6 (two sockets at Node B and two sockets at Node C)
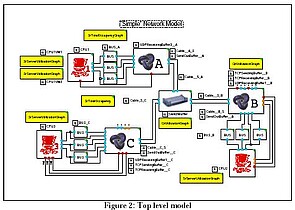
The top-level MLDesigner model (Figure 2) uses custom icons for the CPUs, Nodes and Switch. Quantity and server resources (the small square blocks) model the CPUs, the busses, buffers, and the Ethernet cables. Statistical modules (the yellow/shaded blocks) collect and graph performance data.
Figure 3 shows CPU1. The top two ApplicationProcessData blocks generate messages (driven by periodic and Poisson model models) and pass them to NodeA. The bottom Application Process Data Block receives messages from NodeA. Three hierarchical server resources model the two-layer server resource.
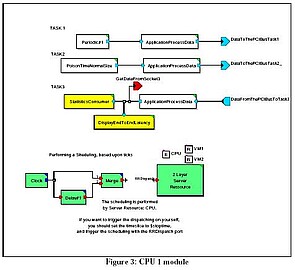
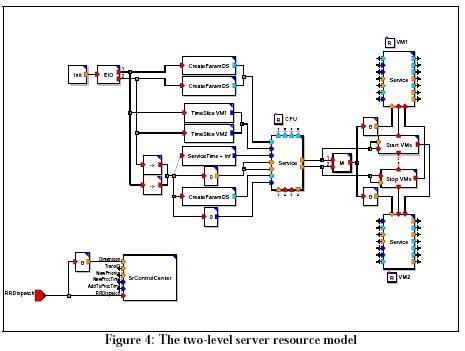
The details of the 2-Layer Server Resources block (in lower left corner of Figure 3) show how the server resource primitives are organized to split CPU1 into two virtual machines (Figure 4 below.)
The model generates both dynamic (during simulation) and summary statistical reports.
This summary graph splits the sample period (300 units) into 50 batches and reports the T1 > T3 mean latency for each batch.
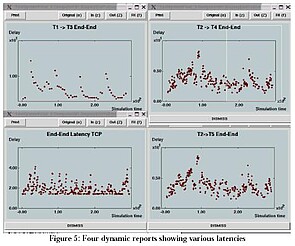
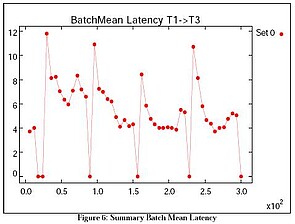
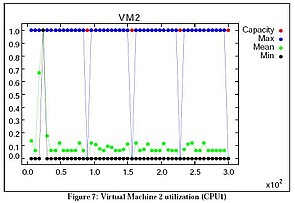
Figure 7 shows utilization of Virtual Machine 2 (refer to Figure 2). VM2 holds Thread 3, which receives messages from Thread 1, VM1. VM1 and VM2 are located in CPU1.
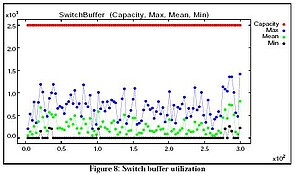
Figure 8 shows switch buffer utilization.