Mainnavigation
Subnavigation
BORDER
Pagecontent
- You are here:
- Home »
- MLDesigner »
- What's New »
- Simulation
Simulation
Reworked Simulation Management
Simulations run detached from main MLDesigner process
Simulations run in a separate process now. This has the advantage that MLDesigner no longer crashes due to programmer error in user defined primitives. This comes along with a couple of changes.
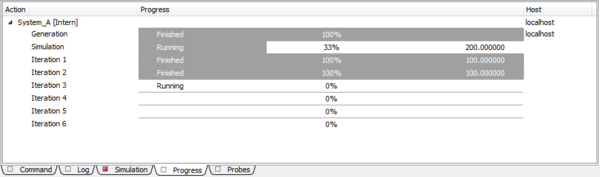
- A simulation has now its own dedicated panel for simulation output, the Simulation panel. The Command panel no longer serves this purpose.
- It is no longer possible to debug user defined primitives by starting MLDesigner in an external debugger. For this, the Debugger Mode was introduced (see below).
Run simulations in Debugger Mode
A Debugger Mode was added to debug user defined primitives with an external debugger. You can choose between a text based debugger (gdb) and a graphical debugger (ddd) in the Settings (Run Control→Debugging).
You can enter the Debugger Mode by a click on the arrow next to the toolbar button Switch to Simulation Mode and choose Switch to Debugger Mode.
On Windows, the only supported debugger at the moment is gdb.
Default setting for Realtime Display of probes
It is now possible to supply the initial default value of the Realtime Display property of a Probe. This can be done by means of the Settings dialog in Run Control→Debugging.
Extension to the PTcl command: stats
The stats command of the PTcl shell has been extended by the keyword cumulative that displays the number of executions and the cumulated execution time by model and not by instance.
Changed FSM initialization
FSM initialization has been changed in such a way that any action associated with the top level default entrance and the entry action of the initial state are performed. While the initial state is a hierarchical state, its default entrance action is executed and its default sub-state becomes the initial state, including execution of the state entry action.